
Pump Characteristic Curve & Operating Point
Definition, System Curves, Affinity Laws & Viscosity Derating
Follow us on Twitter

Question, remark? Contact us at contact@myengineeringtools.com
1. Definition
What is the characteristic curve of a pump ?
The pump characteristic curve gives the hydrodynamic performance of a pump under test conditions by plotting:
- The pump Total Dynamic Head \(H\) (m or ft)
- The pump efficiency \(\eta\) (%)
- The Net Positive Suction Head Required \(NPSH_r\) (m or ft)
- The Brake Horsepower / Shaft Power \(P\) (kW or hp)
As a function of the volumetric flow rate \(Q\) (m3/h or US gpm).
The pump characteristic is an essential engineering tool in equipment sizing, motor rating, operational troubleshooting, and control system design.
The hydraulic power \(P_{hyd}\) imparted to the pumped fluid and the shaft mechanical power \(P_{shaft}\) are governed by fundamental fluid thermodynamics:
In US Customary units:
The example below represents a typical characteristic curve of a centrifugal pump with radial impellers. The curve is valid at a constant rotational speed and impeller trim:
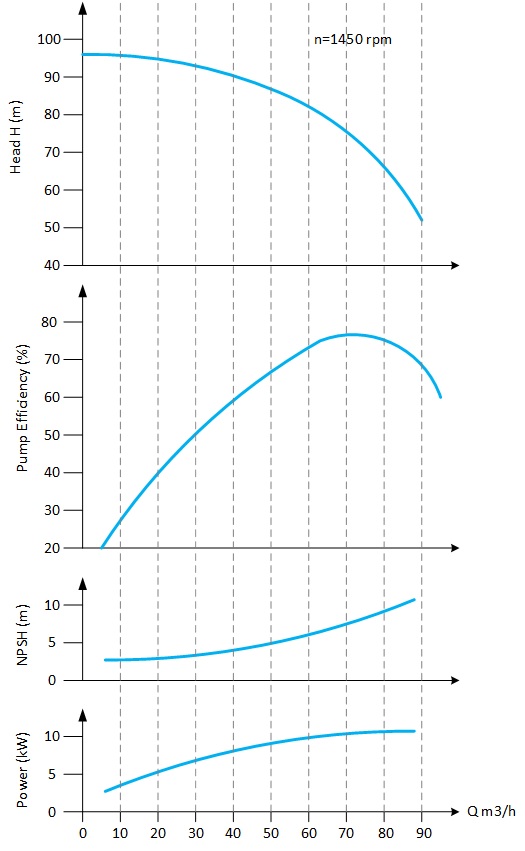
Figure 1 : Pump characteristic curve
The pump manufacturer's standard characteristic curve is determined at their testing facilities using clean, cold water (typically at 20°C / 68°F, \(SG = 1.0\), \(\nu = 1.0\text{ cSt}\)).
2. Use & Operating Point Determination
How to use a pump characteristic curve ?
A pump characteristic curve becomes functional when combined with the system characteristic curve. The system curve represents the response in total head \(H_{sys}\) required by the hydraulic circuit across variable liquid flow rates \(Q\).
The system head is determined by summing the net static elevation difference plus the dynamic friction losses through pipes, fittings, and equipment (refer to Friction Factors and Pipe Pressure Drop):
The intersection of the system curve with the pump head curve defines the true operating point of the process:
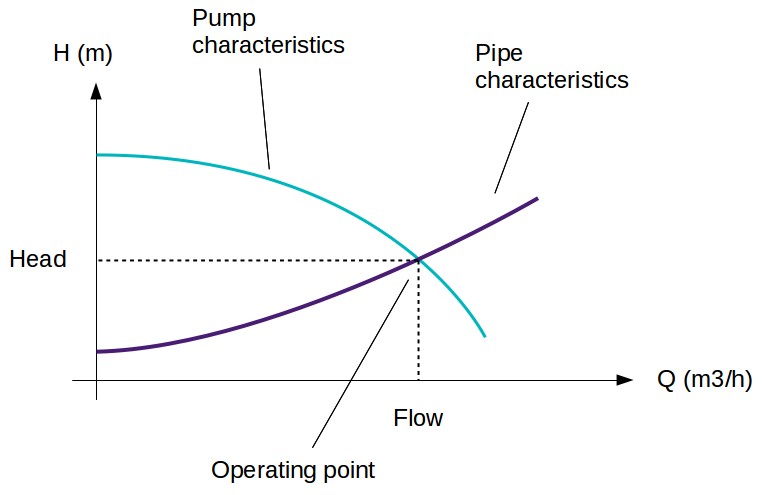
Figure 2 : Operating point
During process design and equipment rating, an engineer must select a pump whose curve fulfills the following technical requirements:
- Delivers the required design flow \(Q\) and dynamic head \(H\).
- Possesses a continuously falling H-Q curve to avoid parallel pump hunting or unstable surging.
- Places the continuous operating point within the Preferred Operating Region (POR): 70% to 110% of the Best Efficiency Point (BEP).
- Minimizes driver electrical consumption and selects an electric motor with adequate nameplate margin.
- Maintains an adequate suction margin where \(NPSH_a > NPSH_r\) under all transient conditions.
3. Changes in pump characteristic due to pump rpm (Affinity Laws)
How does the pump characteristic change with rotational speed and impeller trim ?
Pump characteristics are published at a fixed rotational speed (e.g., 2950 rpm at 50 Hz or 3550 rpm at 60 Hz). When the shaft speed changes (via a Variable Frequency Drive - VFD or turbine) or when an impeller is trimmed down, the performance curves shift according to the Pump Affinity Laws:
Note: Impeller diameter trim laws are approximate for trims greater than 5% to 10% because vane angle profiles and shroud clearances diverge from strict geometric similitude.
4. Changes in pump characteristic due to viscosity
How does liquid viscosity affect pump performance ?
Standard pump curves are certified with water (\(\nu \approx 1\text{ cSt}\)). If the fluid handled has a kinematic viscosity exceeding 10 to 40 cSt (such as heavy hydrocarbons, lube oils, corn syrups, or polymers), significant performance degradation occurs:
- Fluid shear friction across impeller shrouds increases hydraulic disc drag.
- Boundary layer buildup inside impeller flow passages chokes available discharge area.
- Head \(H\) and flowrate \(Q\) decrease, efficiency \(\eta\) drops drastically, and power consumption spikes.
The Hydraulic Institute (ANSI/HI 9.6.7) provides correction factors \(C_Q\), \(C_H\), and \(C_\eta\) to derate water performance to viscous performance:
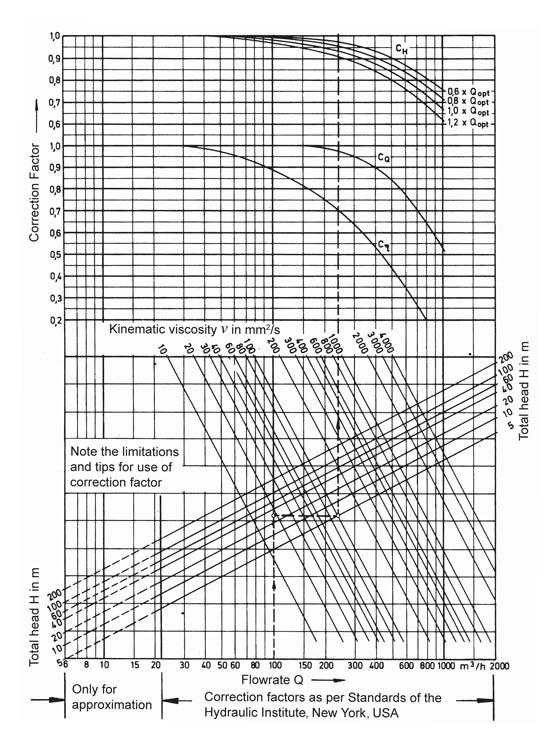
Figure 3 : Viscosity correction chart (Hydraulic Institute Standard)
⚙️ Practical Plant Engineering Best Practices & Operational Safety Limits
- Preferred Operating Region (POR): Keep operating points between 70% and 110% of BEP to avoid recirculation, vibration, and premature mechanical seal wear. The Allowable Operating Region (AOR) is generally 60% to 120% of BEP.
- Minimum Continuous Stable Flow (MCSF): Never operate below manufacturer MCSF (typically 25%–35% of BEP flow) to prevent internal overheating, thermal vapor lock, and heavy radial shaft deflection.
- API 610 Motor Sizing Margins: Select motor driver power with the following safety margins over pump rated shaft power:
• For \(P < 22\text{ kW}\) (\(< 30\text{ hp}\)): +25% margin
• For \(22 \le P \le 55\text{ kW}\) (\(30\) to \(75\text{ hp}\)): +15% margin
• For \(P > 55\text{ kW}\) (\(> 75\text{ hp}\)): +10% margin - Impeller Trimming Boundary: Never trim an impeller by more than 15% to 20% of the maximum cast diameter. Excessive trimming opens casing gaps, causing internal slip and severe efficiency penalties.
- Centrifugal vs. Positive Displacement Threshold: When fluid kinematic viscosity exceeds 250 to 500 cSt, centrifugal pump efficiency plummets below 40%. Consider rotary positive displacement pumps (twin-screw, progressive cavity, or gear pumps).
Centrifugal Pump Characteristic & Affinity Laws Calculator
Evaluate operating power, affinity speed/trim scaling, and viscosity performance derating.